PurposeHow do your customers really feel? View your case sentiments over an expanded timeline and drill into patterns along topics like product lines and regions. Filter your sentiment graphs by customers or agents to see granular insights based on our expanded set of sentiments. |
SummaryTrack positive, negative and product feedback sentiments over the course of days, weeks, or months with Experiential Metrics. There are two tabs to review:
|
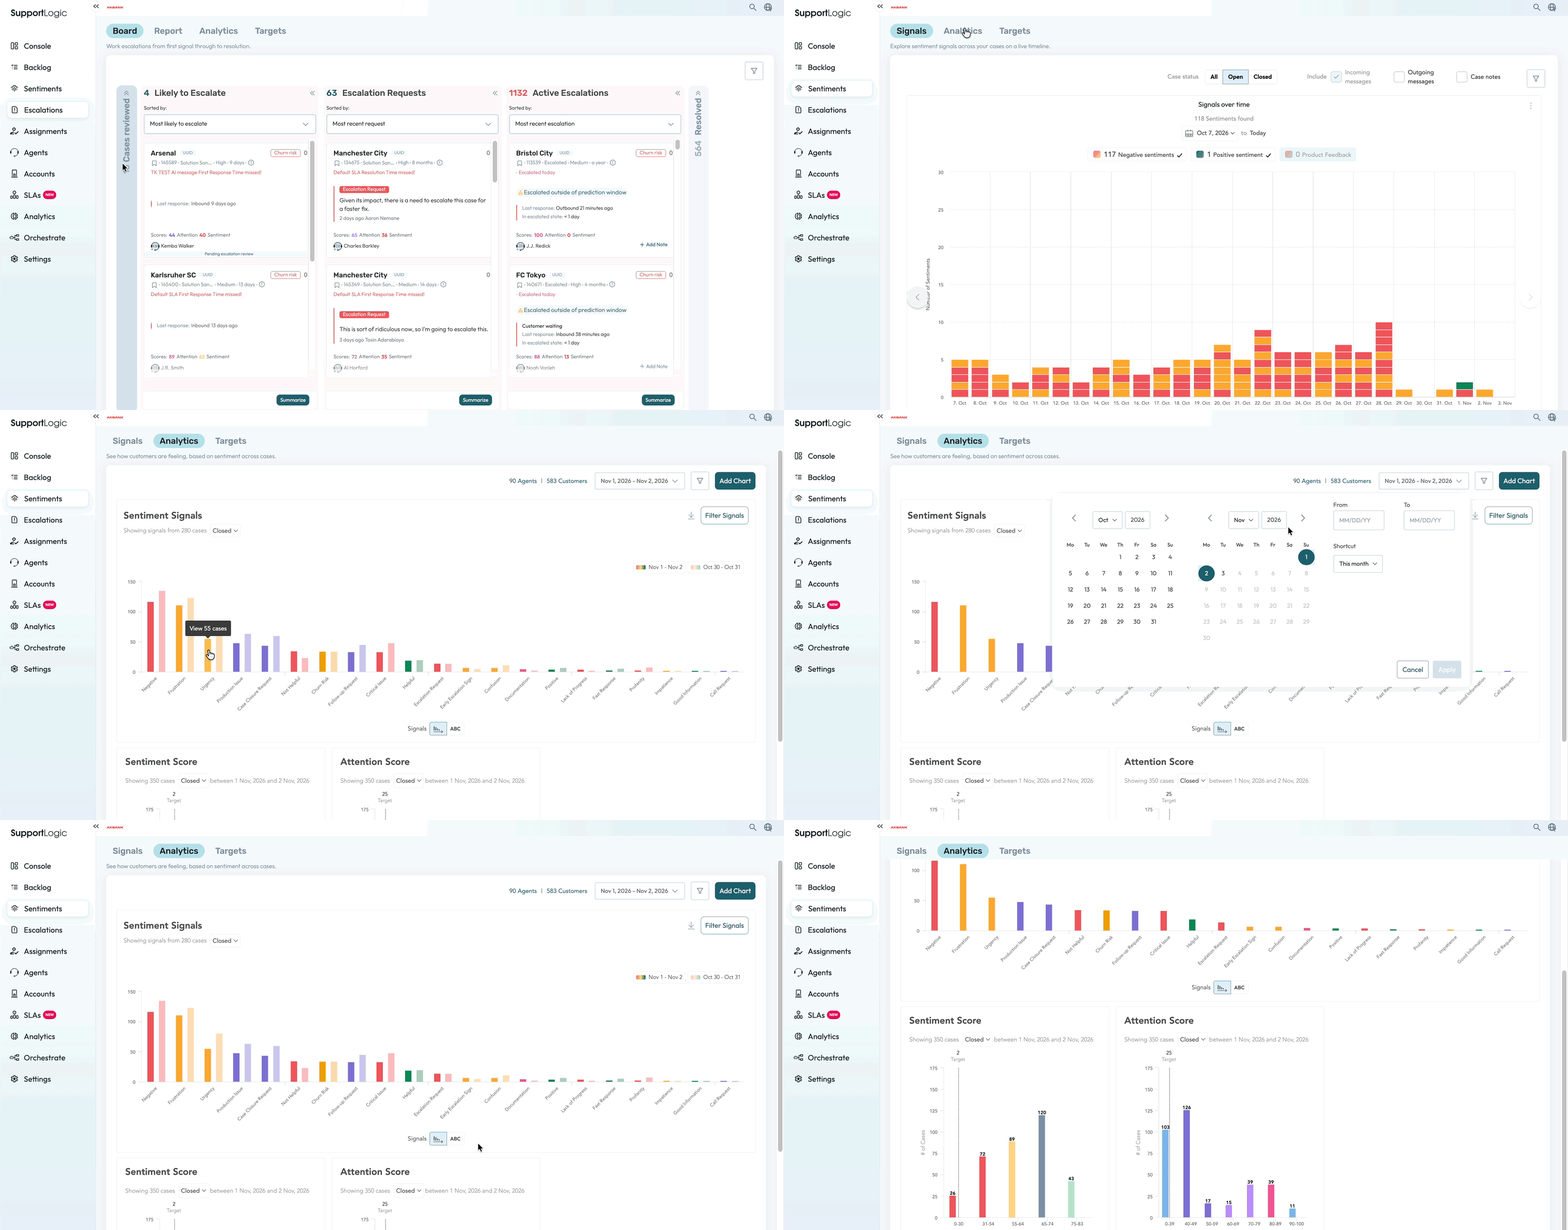
Customer experience Tab
Quickly spot the most frequently expressed sentiment signals by customers over a period of time; review trends on specific signals on closed, open, and all cases over a period of time; or create new trends reports specific sentiments or signals in your support case data.
Sentiments Tab
Determine the time frame you wish to examine, whether you are viewing Open, Closed or All cases for that time period and if you want to view Incoming, Outgoing messages and/or Case Notes.
Based on your selections, the Sentiments chart will display stacked column charts of your cases, highlighting positive and negative sentiments very clearly.
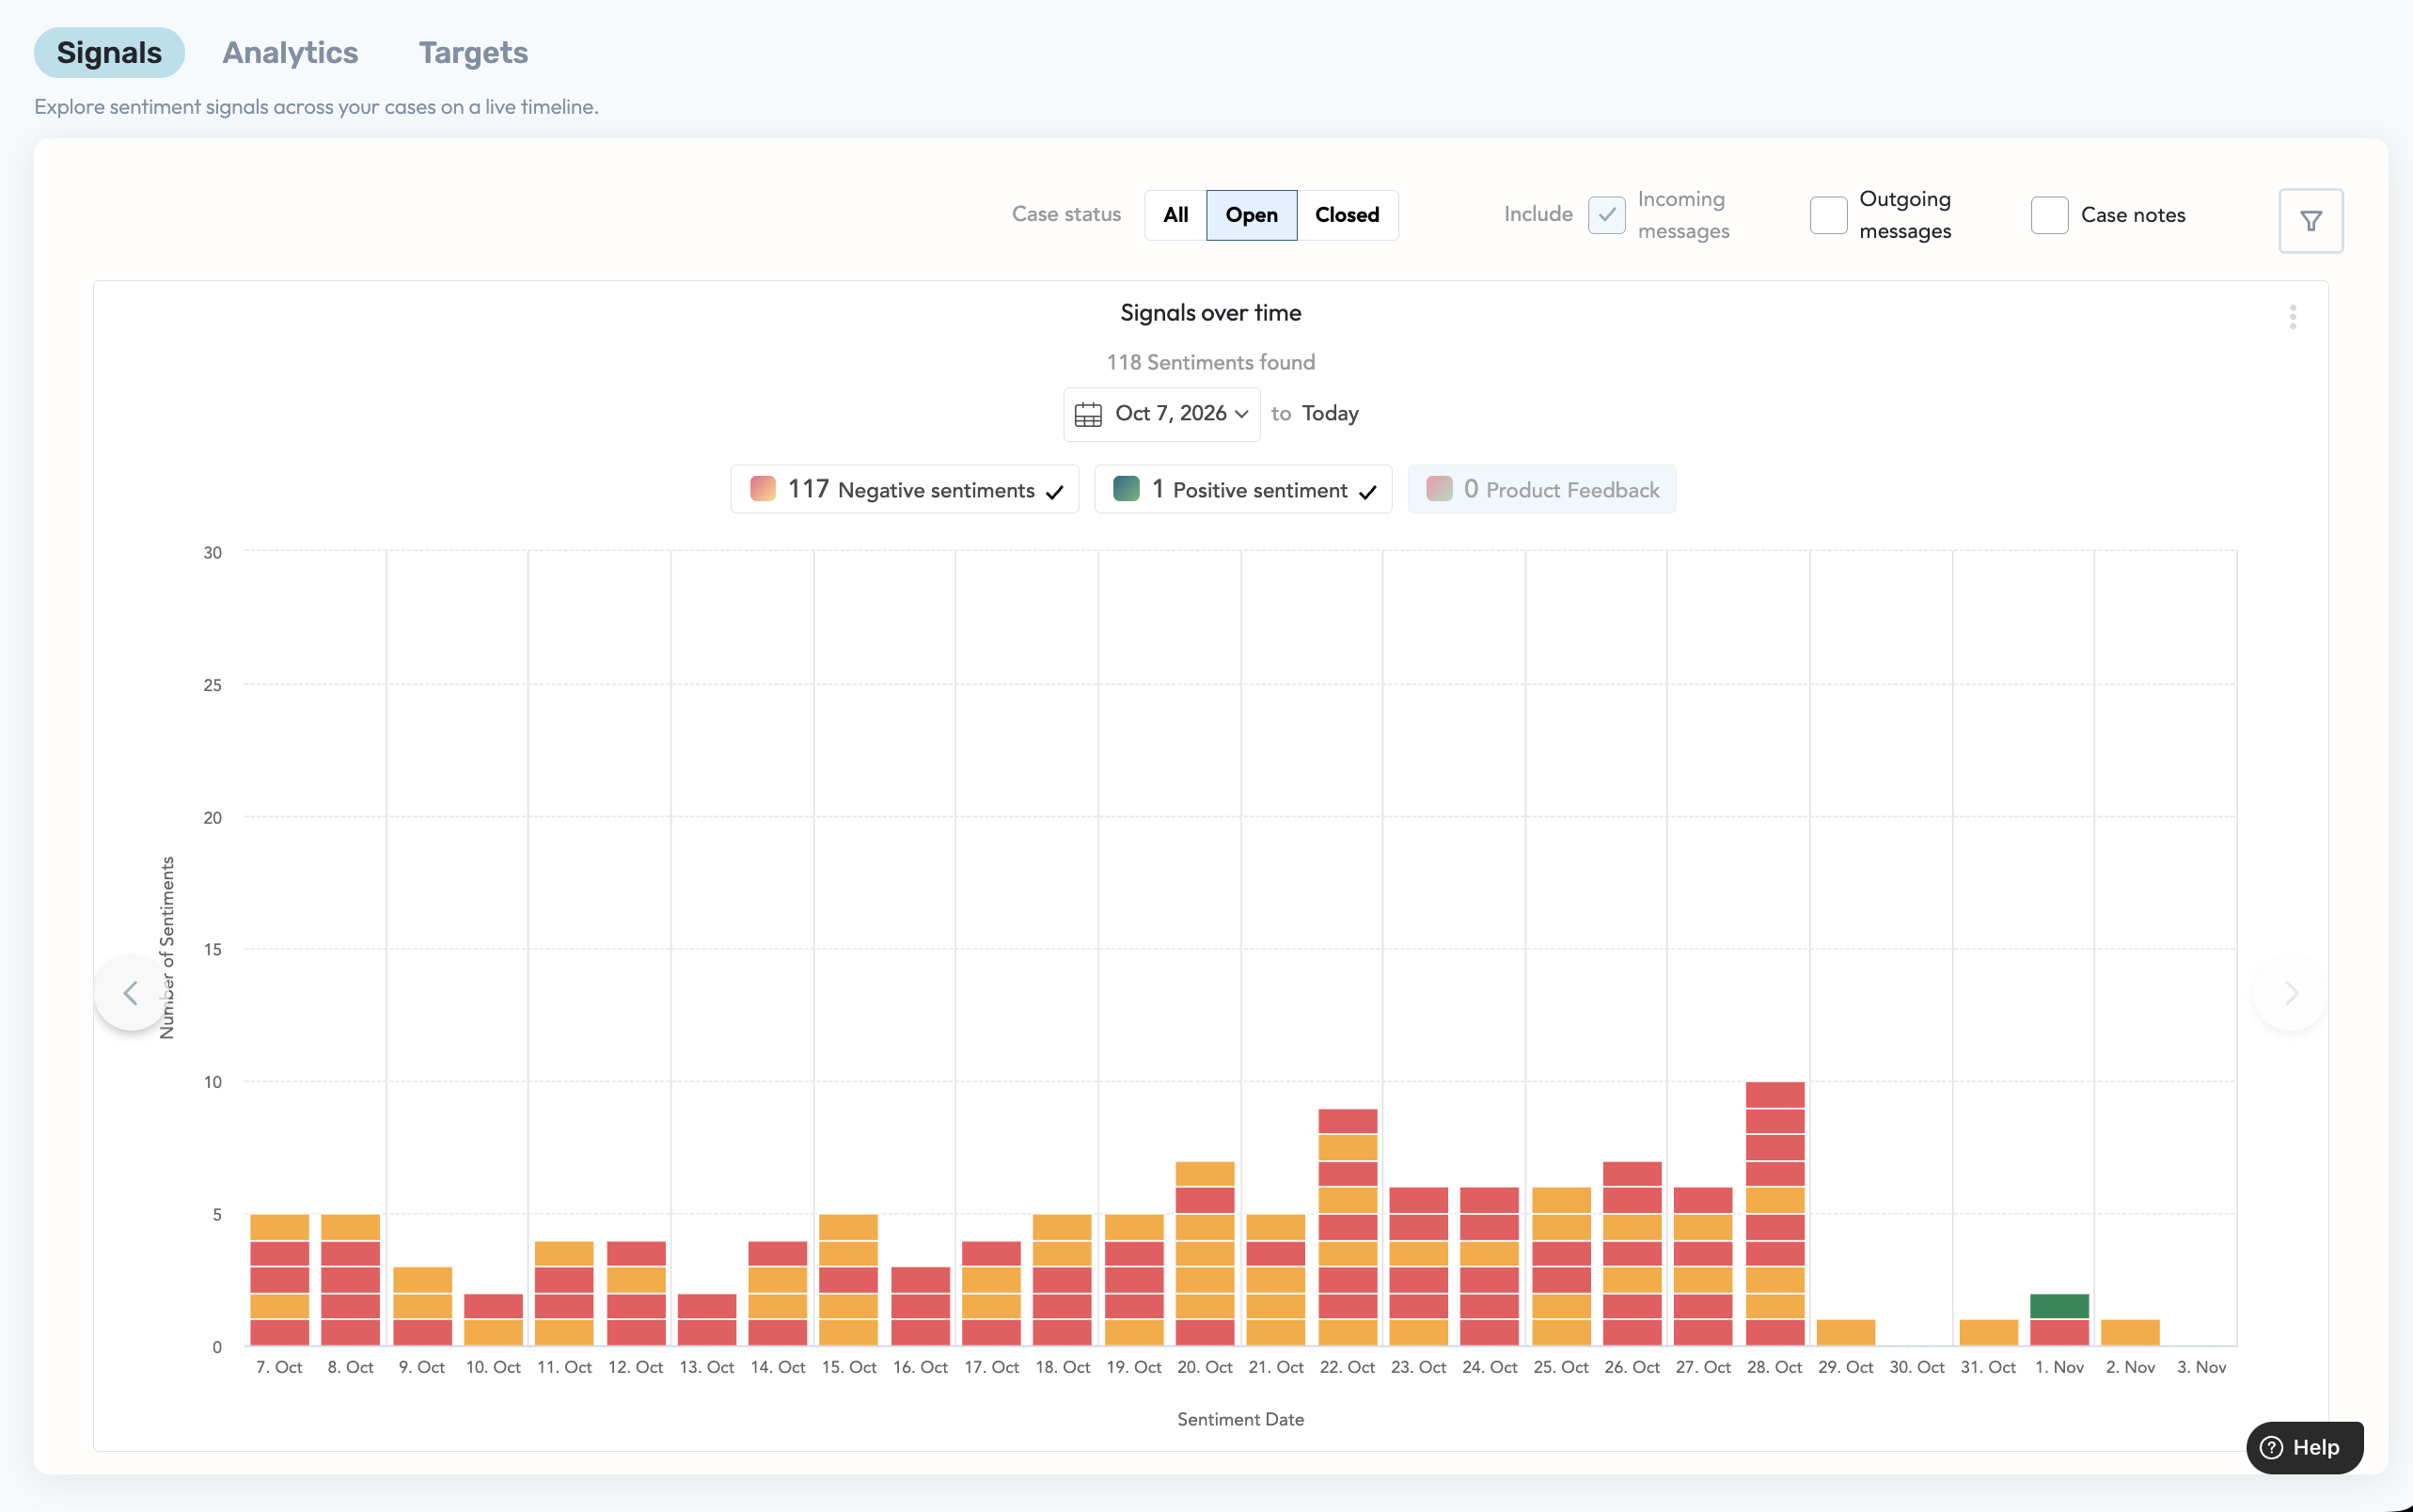
Sentiments Over Time
There are two charts separated by the Sentiment Score Delta (explained in the next section). As with most areas of SupportLogic, your Global Filters will impact what you are viewing in the interactive charts as will any Dynamic Filters you configure for this page.
Use these charts to track the sentiments detected by your customers (and support agents / engineers) over time. You can quickly zero in on the cases that make up these scores as the column chart is interactive, each bar representing a sentiment type detected for the respective day within the time frame you are examining.
Leverage the < > navigation arrows to step back and forth over a variety of periods to identify patterns where sentiment declines or improves to correlate that to events that may have had influence on customer's impression of your organization.
Chart Interactivity
You can take actions on charts directly. The primary options available are:
- Clicking on any of the individual bars in the top chart will open the case where the sentiment was detected
- Apply Global Filters, Dynamic Filters, Case Status, Positive, Negative, and Product Feedback quickly to zero in on influencers of sentiment change
- Review day by day Sentiment Score Delta changes by click on the positive or negative number next to the center score metric between the two charts
Was this article helpful?
That’s Great!
Thank you for your feedback
Sorry! We couldn't be helpful
Thank you for your feedback
Feedback sent
We appreciate your effort and will try to fix the article